Apr 27, 2021
A roundtable discussion with academic researchers from Queen’s University along with Measurand’s director of research took place in December 2020. Queen’s University’s Dr. Andy Take, and Dr. Neil Hoult joined Measurand’s Christiane Levesque, director of research, and Tyler Morency, content manager, to discuss their recent research project in rail settlement monitoring with Measurand’s ShapeArray.
Dr. Andy Take and Dr. Neil Hoult, the project’s two lead researchers, presented their co-authored paper, “Evaluation of ShapeArray sensors to quantify the spatial distribution and seasonal rate of track deformation,” which describes the advantages of horizontally installed ShapeArray to monitor seasonal track settlement compared to optical measurement methods traditionally used to gather similar sets of data.
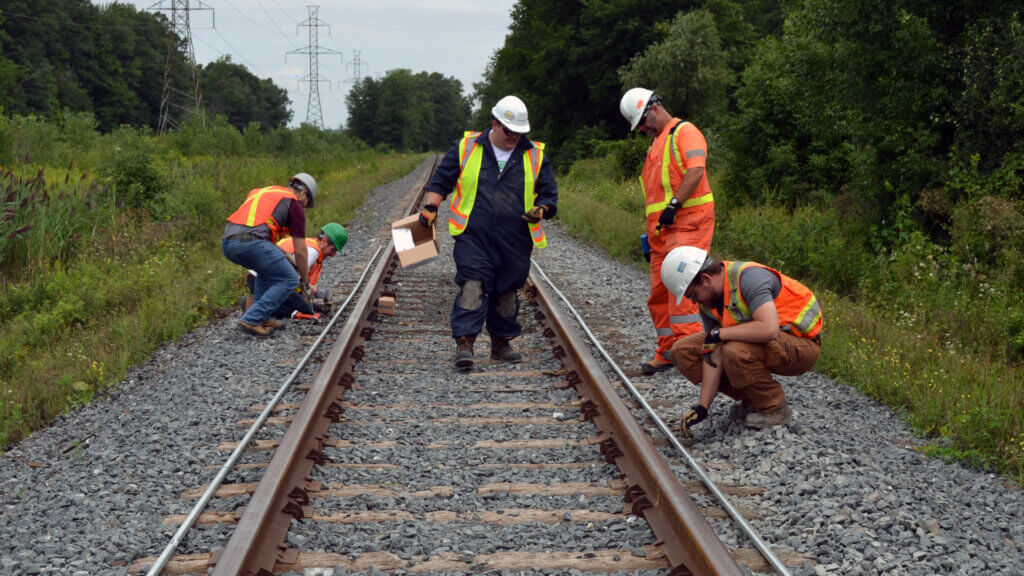
The test site in this case study was a spur line with very low train traffic: just two trains per day, one loaded and one unloaded. Although the trains’ speed on the spur was limited to just 16 km/h in order to preserve the track geometry, localized soft spots 20 to 25 m long led to deformations large enough to be visible with the naked eye. Because of this, the spur had to be reballasted three times a year.
Overall, the site provided the perfect scenario to examine the following questions:
To answer these questions, the researchers needed technology that could measure changes in the deformations in both space and time.
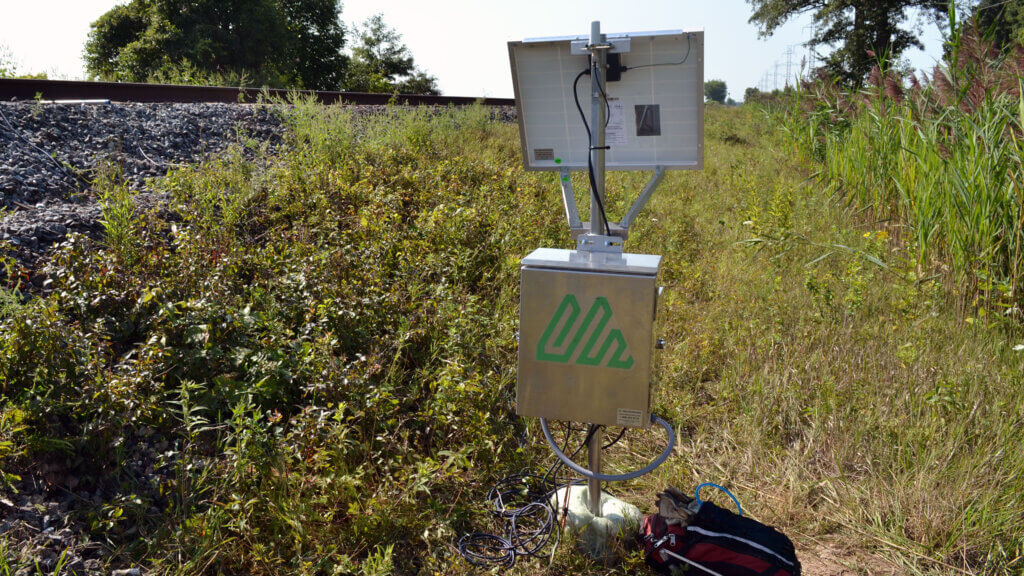
Researchers selected ShapeArray to evaluate its field performance in this research project based on several factors. Unlike optical measurement systems, ShapeArray takes its measurements by determining the angle of displacement of several rigid segments joined end-to-end with flexible joints. Each individual segment’s tilt angle is multiplied by its length and roll offsets to determine the segment’s precise orientation, and the data from each segment are combined to provide detailed information about the shape of the entire array.
A major factor in the decision to use ShapeArray was its ability to supply frequent, in this case hourly, real-time deformation measurements, allowing a fine-grained view of the site over time.
Additionally, researchers took ShapeArray’s ease of installation and configuration for remote data collection into account. Once installed and configured for remote data collection, continual on-site access is not required to take reading samples.
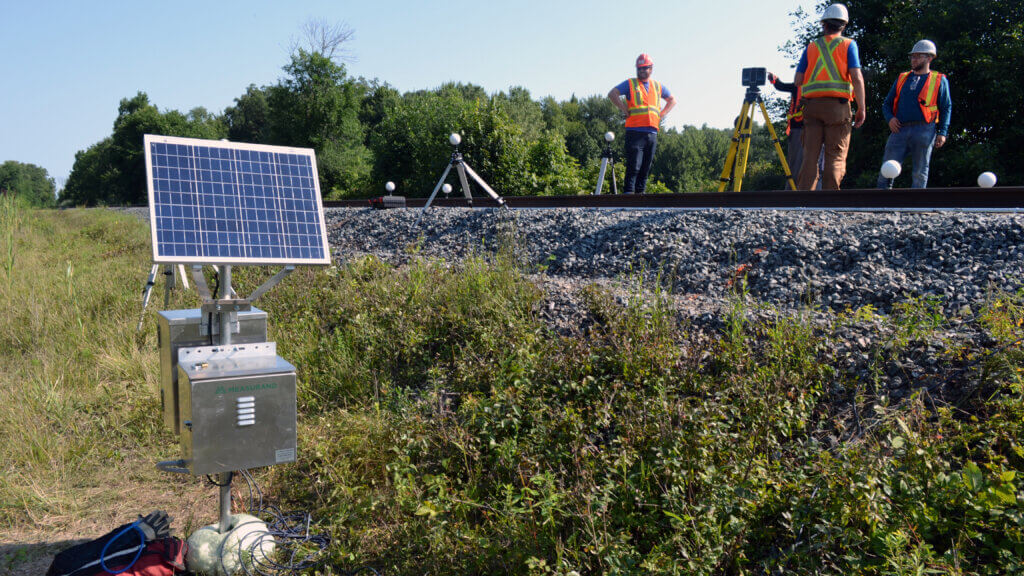
Researchers used a ShapeArray system composed of:
Researchers installed the two instruments, one on either side of the track, to monitor the twist of the rail track.
ShapeArray was not the only monitoring tool used in the study. The researchers used a FARO Focus S terrestrial laser scanner to complete LIDAR (Light detection and ranging) scans to obtain detailed measurements of the track’s embankment, rails, and ties at intervals of one-half metre to a metre.
This technology gave a very high-resolution view of the track’s spatial characteristics, excellent for baseline measurements. However, the process is time-consuming—a single scan requires an entire day of work and could only be done during times when there was no rail traffic—not suitable for continuous monitoring.
Comparing the LIDAR data with the ShapeArray data confirmed that both methods provided accurate measurements of the shape of the displacement bowl. The lidar had a few more glitches in its data points because it provides a point cloud rather than singular points, which could sometimes miss the mark because of interference from airborne particles.
After just one month, the ShapeArray showed a very consistent bowl shape, picking up a displacement of 10 mm. After eight months of monitoring, the results of the lidar and ShapeArray systems were still within 7 mm of each other. The major difference, though, was that ShapeArray was able to provide hourly on-site readings for the entire period.
Another important feature of ShapeArray’s monitoring was the cross-level information it provided. This was why the choice to put ShapeArray on both rails was so important: it allowed for almost real time measurement of differential settlement.
This was done by comparing the displacement from each rail’s ShapeArray to determine the angle of the ground perpendicular to the tracks. The researchers found that the west rail was invariably lower than the east rail, with a difference of upwards of 40 mm. Although this difference was within the allowable amount for the site, it was useful to be able to capture this additional information because it helped the researchers better understand the failure mechanisms.
The main advantage to the ShapeArray data in this case was that they were logged hourly. This made it possible to monitor the development of the displacement bowl’s shape over time, showing the effects of the changing seasons. This degree of temporal granularity would be impossible with monitoring provided only by LIDAR.
This temporal resolution was important because it showed that the total amount of deformation was not the result of a single failure event, but the cumulative result of small daily displacements influenced by seasonal levels of ambient moisture. The two different methods of data collection tell two different stories, and with the lidar, a significant part of the picture is lost.
Having this data not only better illustrated what the cause of the problem was but also helped the researchers to suggest better solutions for how to mitigate those failures. This case shows how ShapeArray can be more than just a monitoring tool; it can also play an important role in preliminary problem solving on the investigation side. Knowing and understanding the problems is key to finding the right solutions. ShapeArray provides that extra information.
What’s more, whether it is cross-level data or overall displacement, it is easy to automate the monitoring to provide alerts when certain thresholds are crossed. Data from ShapeArray is fast to convert and interpret. This contrasts with data from a LIDAR system, which, for all its precision, requires extra work to process that can be impractical in situations where regular readings are needed.
An even less practical alternative method for gathering data was a manual total station survey. Aside from the potential human error inherent in the need to physically hold a prism pole straight for each reading, this method encountered the same time problems as the lidar in terms of time required to take the readings.
One of the biggest challenges with rail remediation is determining whether a remediation strategy has solved the problem. A major benefit for rail owners and managers of collecting data with ShapeArray is its ability to quantify how well these strategies have worked. By installing ShapeArray before the intervention, you can determine what precisely the problem is, what rate it is occurring and if it is seasonally affected. And once the remediation work has been completed, you can reinstall the ShapeArray and see how the displacement has changed—has it solved the problem or made it more manageable than having to reballast every few months? All this is possible because of ShapeArray’s quick installation and the ready access to the data it provides.
References:
[1] R. Yan, A. W. Take, N. A. Hoult, J. Meehan, and C. Levesque, “Evaluation of Shape Array sensors to quantify the spatial distribution and seasonal rate of track settlement,” Transportation Geotechnics, vol. 27, p. 100487, Mar. 2021, doi: 10.1016/j.trgeo.2020.100487.